<img height="1" width="1" style="display:none" src="https://www.facebook.com/tr?id=8347180831966915&amp;ev=PageView&amp;noscript=1">

Debt-to-equity ratio

Featured Image

What is
Debt-to-equity ratio?

The debt-to-equity ratio is a financial metric that compares a company's total debt to its total shareholders' equity. It indicates the proportion of company financing that comes from creditors and investors.

Key takeaways

1
Leverage indicator

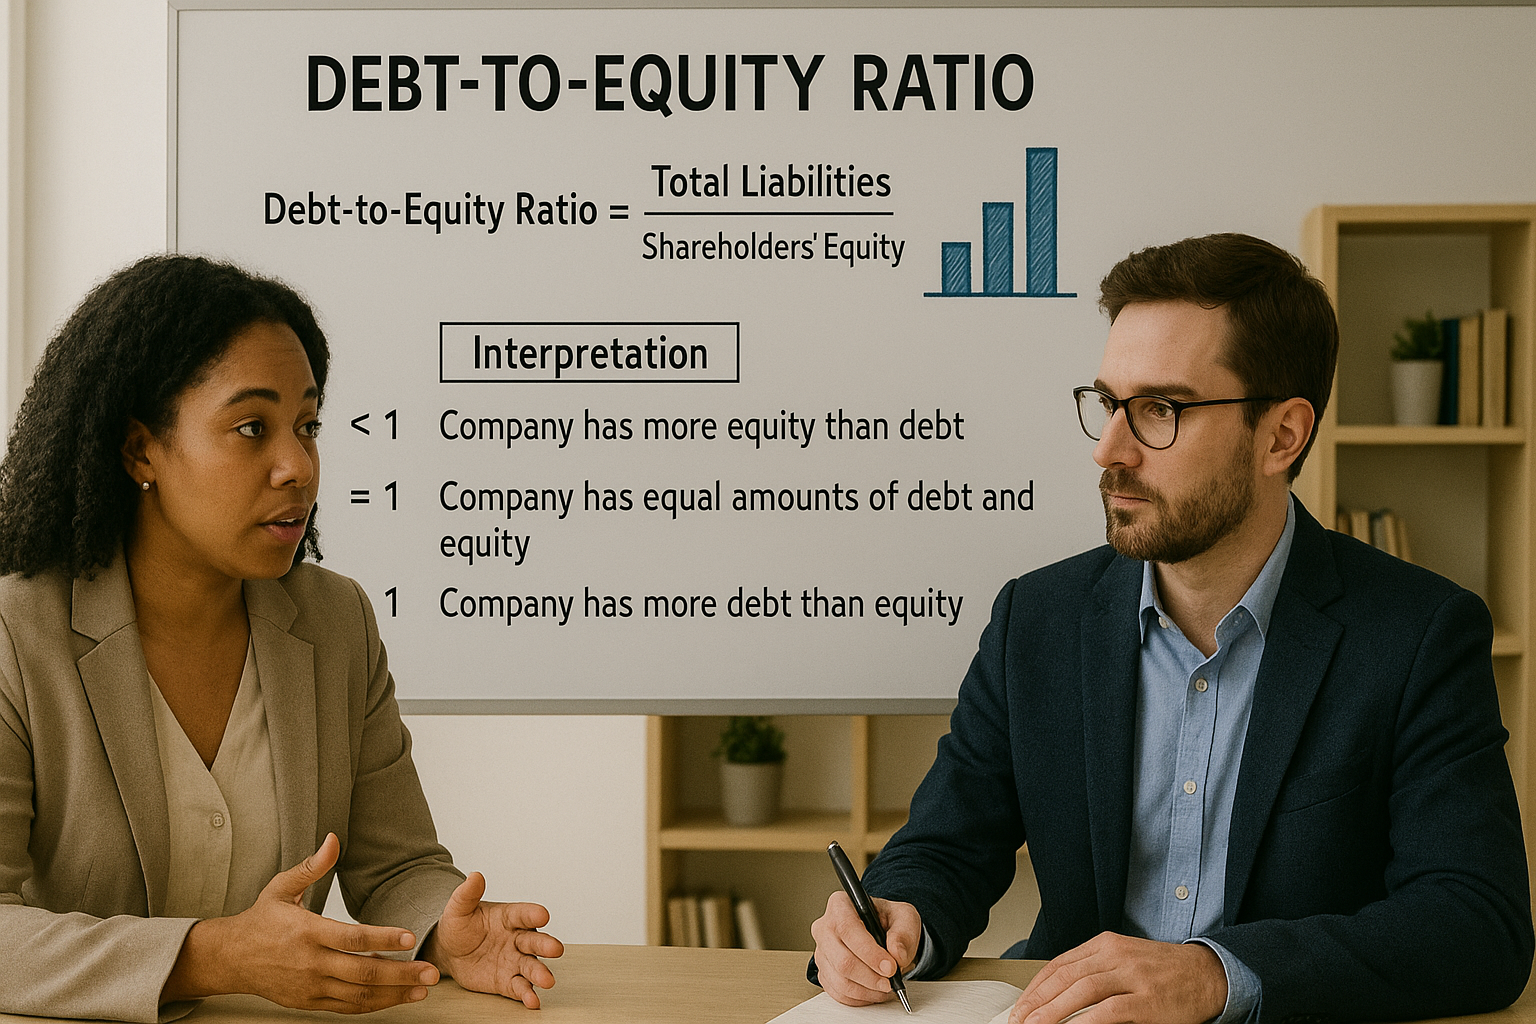
Measures the extent to which a company is funding its growth with debt versus equity.

2
Higher ratio = higher risk

Indicates heavier reliance on debt, which can lead to increased financial obligations.

3
Lower ratio = more conservative:

Reflects cautious capital structure with lower debt exposure.

4
Important to investors and creditors

Helps assess financial health, risk appetite, and repayment ability.

5
Industry-sensitive

Optimal ratio varies across sectors depending on capital intensity.

Why the debt-to-equity ratio matters

The D/E ratio is a cornerstone of financial analysis. Lenders look at it to evaluate a company's creditworthiness, while investors use it to understand the risk-reward balance. A high ratio might signal aggressive growth funded by borrowing — which could lead to higher returns, but also higher financial stress in downturns. A low ratio may suggest stability but also missed growth opportunities.

How it’s calculated

Debt-to-Equity Ratio= Total Liabilities/shareholders' Equity

Both values are pulled from the company’s balance sheet.

Interpreting the ratio

  • A D/E ratio > 1 means the company has more debt than equity — potentially risky but common in capital-heavy industries.
  • A D/E ratio < 1 indicates the company is primarily financed through equity — typically seen as less risky.
  • Comparing D/E ratios only makes sense within the same industry, as capital structures vary widely.

Impact on financial statements

Blue border

The D/E ratio directly ties into the balance sheet. It influences:

Risk assessments by lenders and credit rating agencies.

Cost of capital — higher debt increases interest expenses.

Return on equity — leverage can amplify returns when used effectively.

Impact on financial statements

The role of financial strategy

Management often adjusts the D/E ratio as part of broader capital planning. Leveraging debt can reduce the weighted average cost of capital (WACC) if done wisely. However, excessive debt can lead to solvency issues — especially during downturns.

Real-world examples

Blue border

Case study: 

Tata Motors’ evolving debt-to-equity strategy

In the early 2010s, Tata Motors took on significant debt to fund the acquisition of Jaguar Land Rover. This pushed its D/E ratio above 2.5, raising investor concerns. Over the next decade, the company focused on deleveraging through improved cash flow and asset sales. By FY24, Tata Motors had brought its D/E ratio closer to 1.5 — signaling improved balance sheet health.

This evolution showcases how strategic debt management can balance growth and financial discipline.

Frequently asked questions about debt-to-equity ratio

Blue border
Not necessarily. It depends on the industry and context. For example, utility companies often have high D/E ratios due to stable cash flows.
Increases in debt or reductions in equity (e.g., losses, dividends, buybacks) raise the ratio. New equity issuance or debt repayment lowers it.
They assess whether the company is over-leveraged, has room to borrow, or may face financial stress in a downturn.